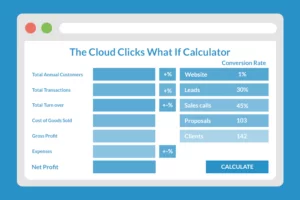
How to use the business growth calculator
Numbers don’t lie. This is why we came up with a simple business growth calculator to help you explore how to grow your revenue and profits.
To use the business calculator, follow these simple steps. It is best to have your P/L ready to get the most accurate numbers.
Step 1 – this page
With P/L on hand, refer to your business data from the previous financial year. Or you can also use data from the past 6 or 12 months.
Current active customers (within the year):
How many unique customers used your services the previous year (the past 12 months). This data should be in your database.
Customers leaving (per year):
How many customers have you lost during the past 12 months? E.g how many customers could have bought from you but did not? Or ended their service contract with you. Some industries, like say the moving business, could have a 100% turnover of customers each year.
New customers (%)
This tab is for new customers who started using your products and services in the past 12 months. If they paid you, they are a customer.
Transaction frequency
How many times did each customer transact with your business? If you’re selling a subscription service, customers might transact 12 times per year. The easiest way to figure this out is by counting all invoices sent in the past year and dividing it by the number of customers you serviced.
Total transactions:
How many transactions in total did you log last year?
Average sale :
What is the average cost of each transaction? If you don’t have this data, you can check Xero. Open accounting dashboard. Select Profit & Loss sheet and select the last 12 months. Click on the revenue tab to see the list of transactions and sales for each.
From the revenue sheet, you will be able to count how many transactions were logged in total. Divide the total sales revenues by the total number of transactions. The figure is your average sale.
Cost of goods sold in %
What is the cost to deliver your product or services? E.g if you sell a widget for $10 and you buy that widget for $2, your cost of goods sold is $2
variable expenses in %
There are variable expenses such as shipping, hours your team spends on delivering a service, etc. that is dependent on the volume of transactions. Variable expenses grow as more goods are sold and they ideally decrease when sales decline.
Fixed expenses:
Fixed expenses such as office rent, salaries, retainer fees, car amortization, etc. go into this tab.
When all the tabs are filled in, you will see your NET PROFIT from the whole year.
Now comes the exciting part –
Step 2! Begin by hitting IMPROVE MY PROFITS.

